How active is your active portfolio?

The global macro environment has become more challenging in the last month, obviously. Energy prices have spiked causing more risk of inflation which leads to expectations of higher interest rates and negative impacts on consumers globally. Stagflation (weakened growth but with higher inflation and, therefore, higher interest rates) is clearly a negative scenario for markets. Equities, bonds and gold have all fallen as market anxiety has built this year; being passive can be painful when asset classes are correlated when falling in periods of market volatility. We have discussed before how passive portfolios can have long periods of delivering negative returns when growth, inflation and interest rate expectations turn negative. There can, however, be benefits from blending passive and genuinely active portfolios. It is fair to ask, therefore, if “active” portfolios are genuinely active in composition and what activity there has been in reaction to the world economy potentially heading into stagflation.
The W1M Asset Allocation Committee had an ad hoc meeting at the end of last week and has retained an underweight fixed income position, reflecting greater inflation risk in the world economy. Positive exposure to Real Assets and Absolute Return strategies is maintained. Equity positioning is broadly neutral given a consensus market belief that a shorter conflict is in most countries’ interests, including the US and China, and if that is what happens and global growth remains positive this year and next, then equities can have upside from current levels. Clearly, a longer conflict which leaves the world in stagflation would be much more negative for equities and bonds, but that is not the base case currently.
Summary of our views
March 2026 Asset Allocation positioning
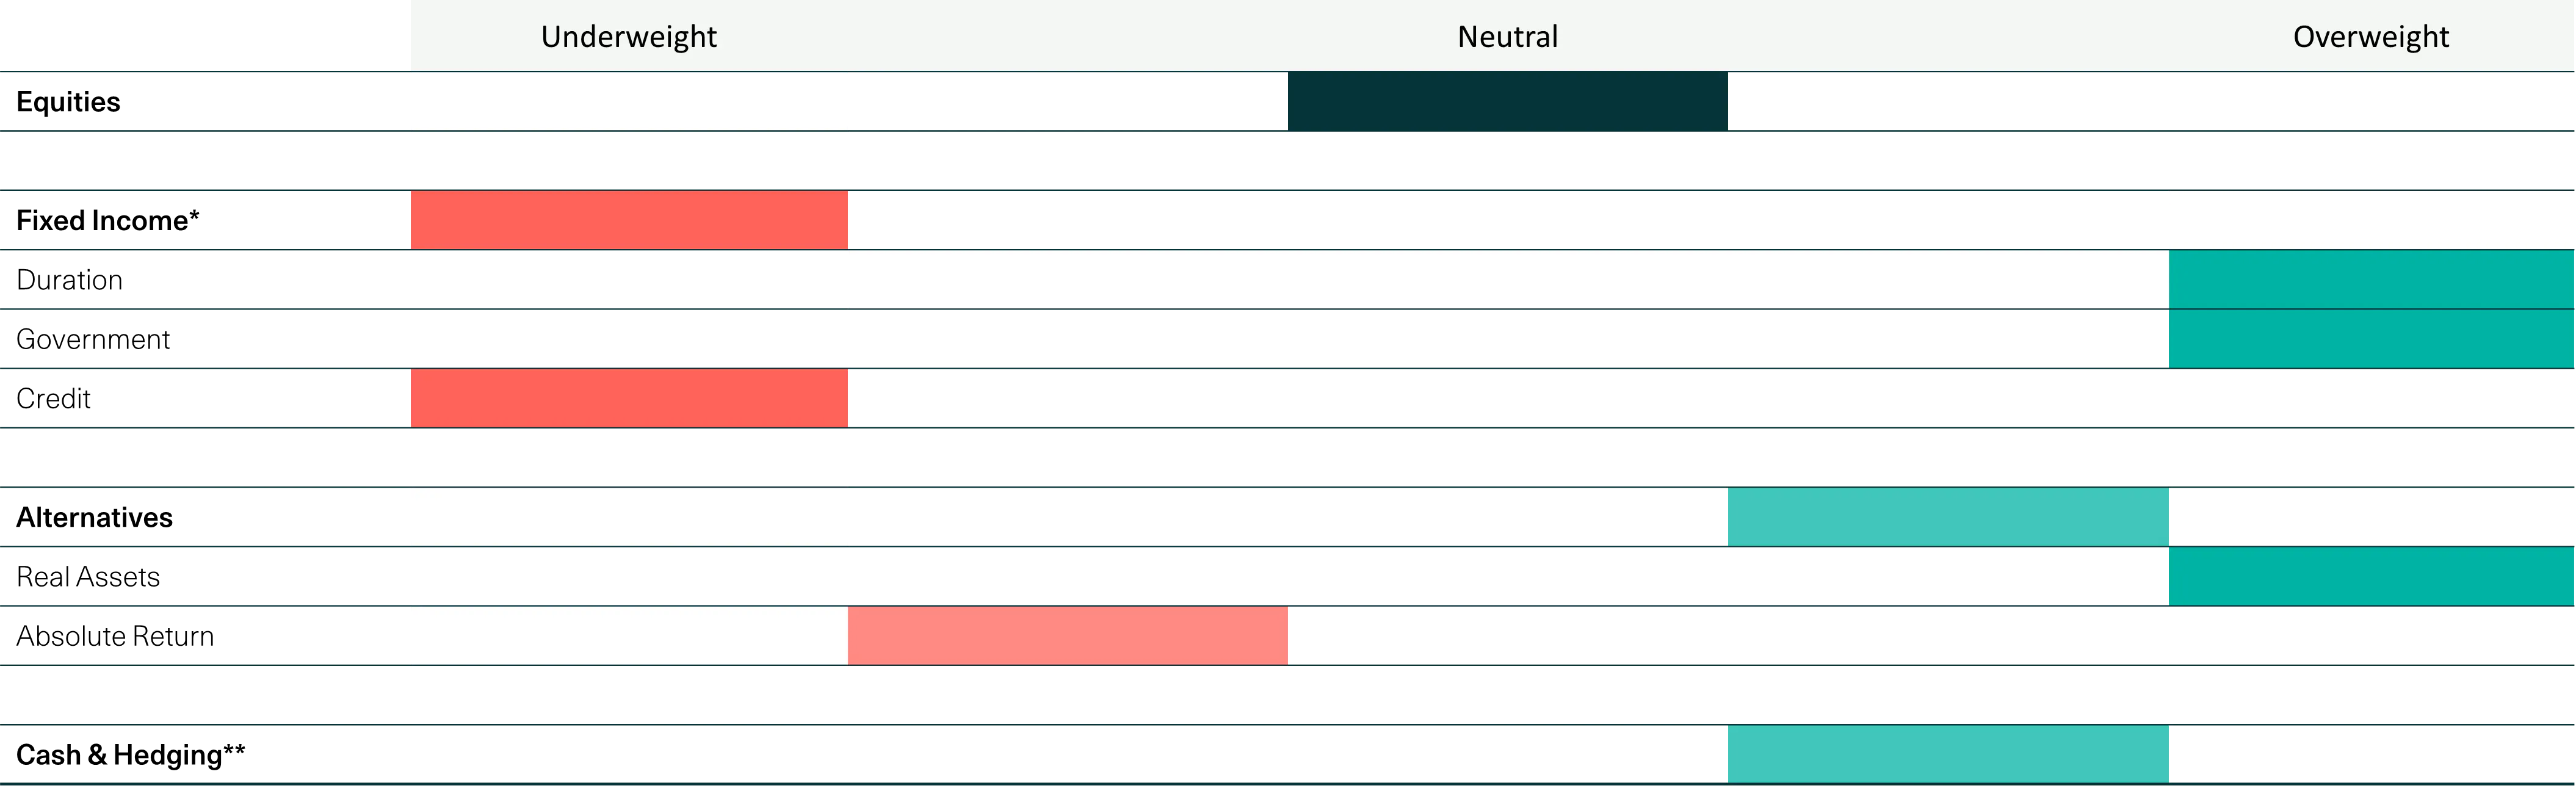
*The table shows bond allocations relative to bond composite index
**Hedging includes gold & Protection Strategy if possible.
Source: Morningstar. As at 05.03.26. The weightings are calculated as a percentage of the Waverton Balanced platform model portfolio and the peer group equivalent of Model GBP Allocation 40-60%. MSCI AC World weighting assumes a 60% allocation to equity. The above should be used as a guide only and is subject to change.
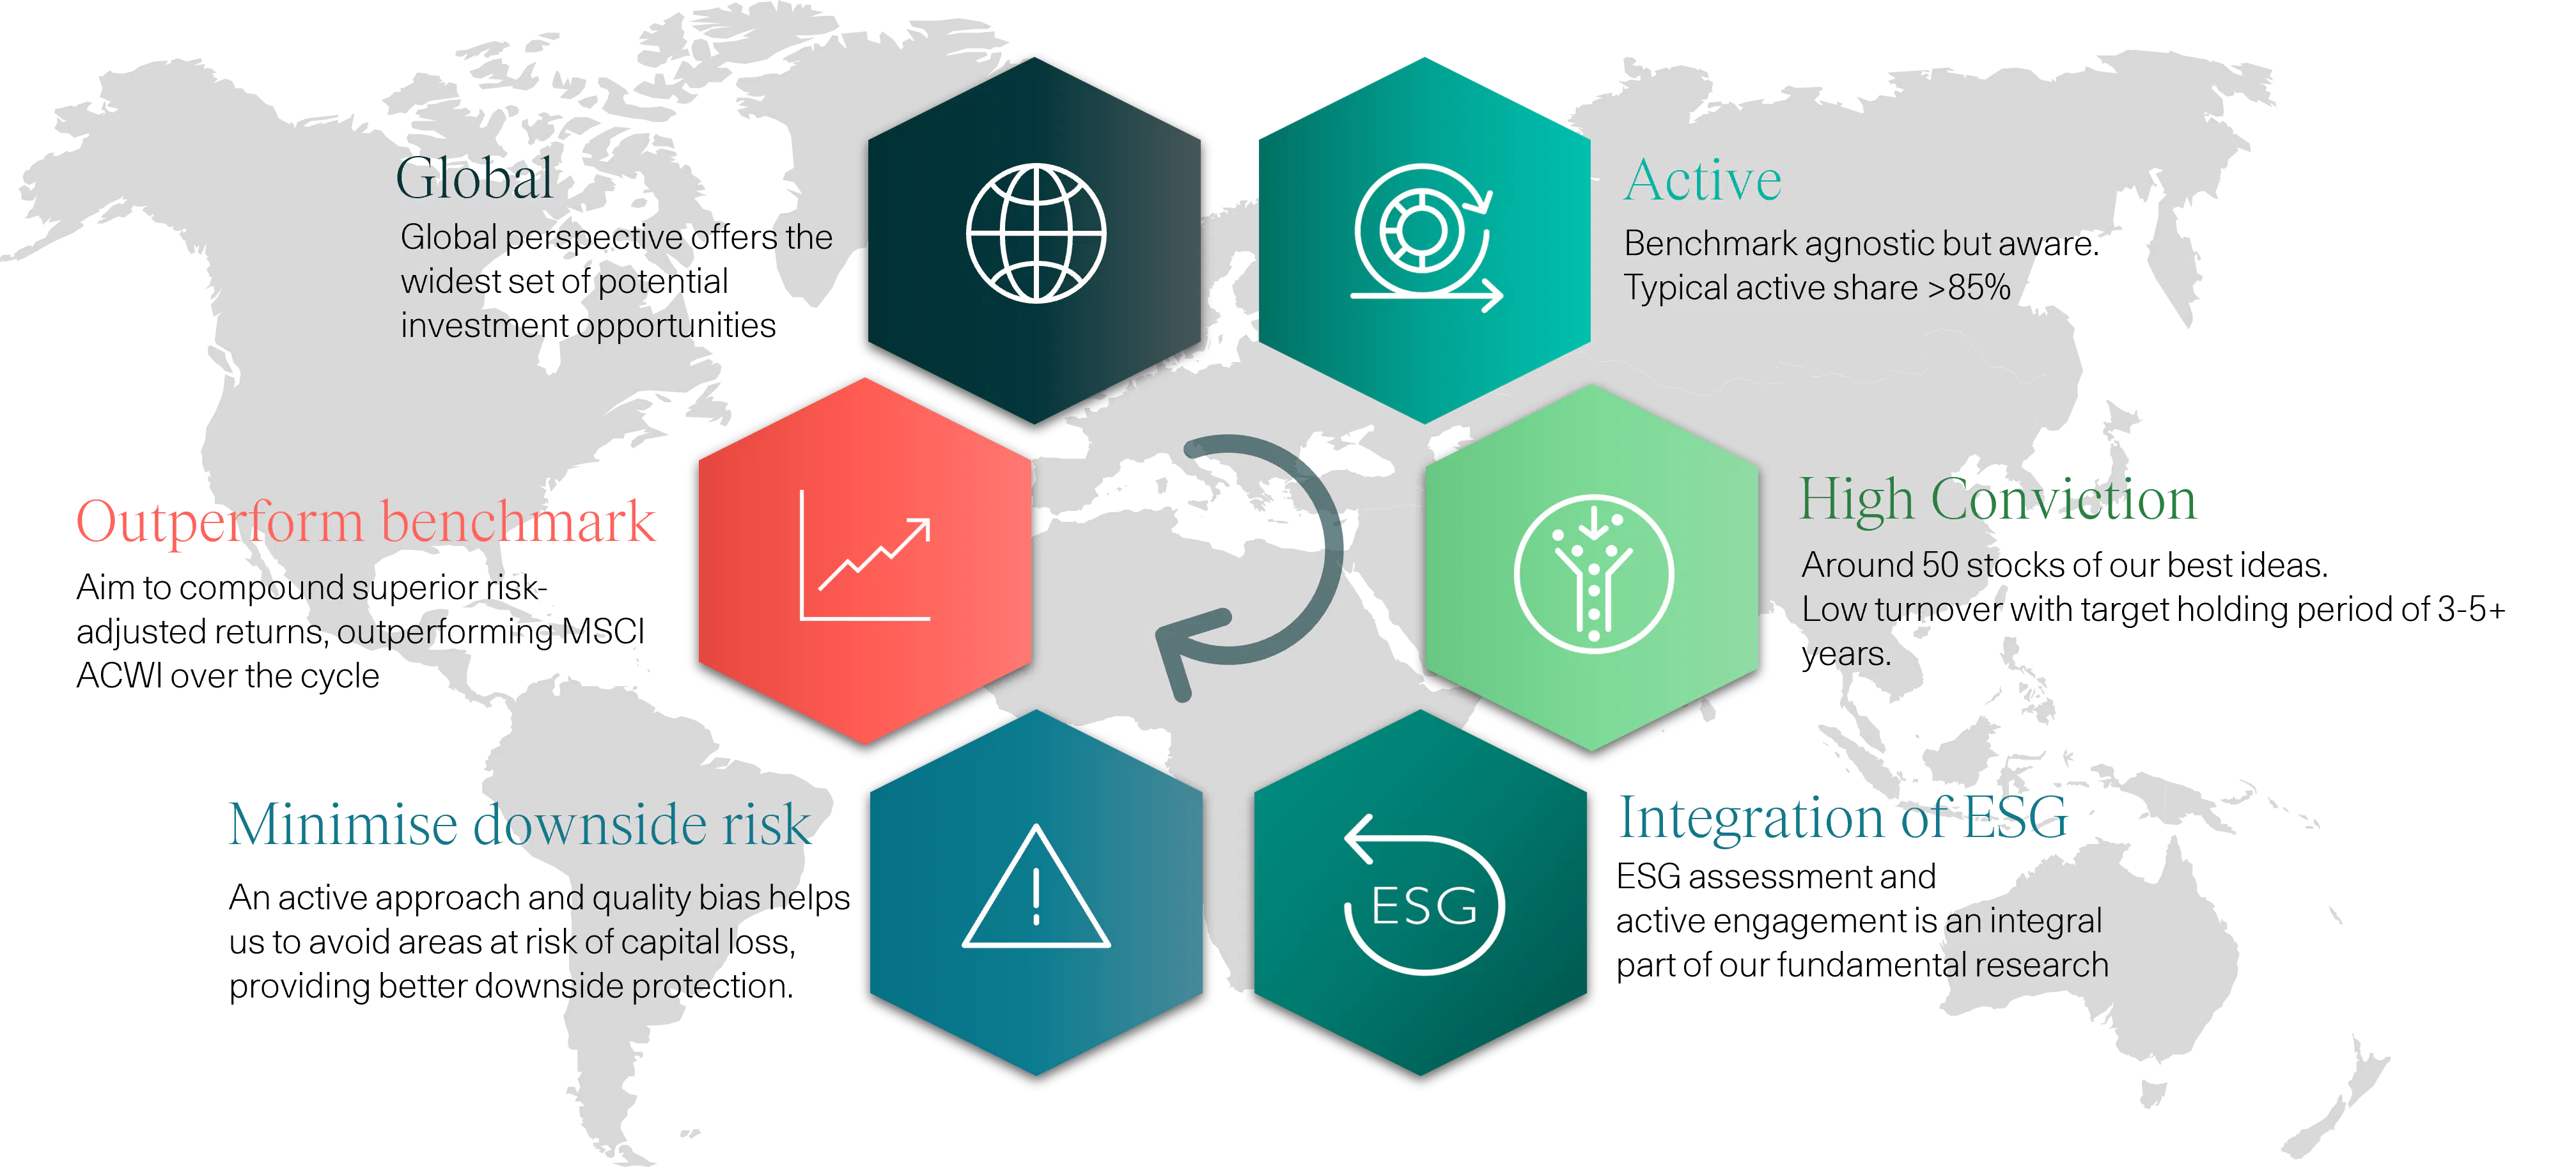
The W1M approach is transparently active.
Our equity portfolios do not hold index trackers but around 50 stocks based on a 3-5 year investment time horizon for each of them. We are not buying funds but investing directly in our fixed income and real assets portfolios. Absolute return and protection strategies are designed specifically for our portfolios and included in bespoke and model portfolios as well as multi asset funds. Fund managers are not making changes once a month or quarterly but are free to make changes on any day, if necessary. The changing global macro environment has necessitated some changes in portfolios and we have actively responded as discussed below.
W1M approach
Equities
W1M equity portfolios tend to have around forty to fifty stocks. This allows proper diversification while enabling deliberate exposures to be taken. The first question we have asked and been able to answer relates to how sensitive our stocks are to different impacts resulting from the middle east conflict.
Equities: Impacts from Middle Eastern Conflict Differ
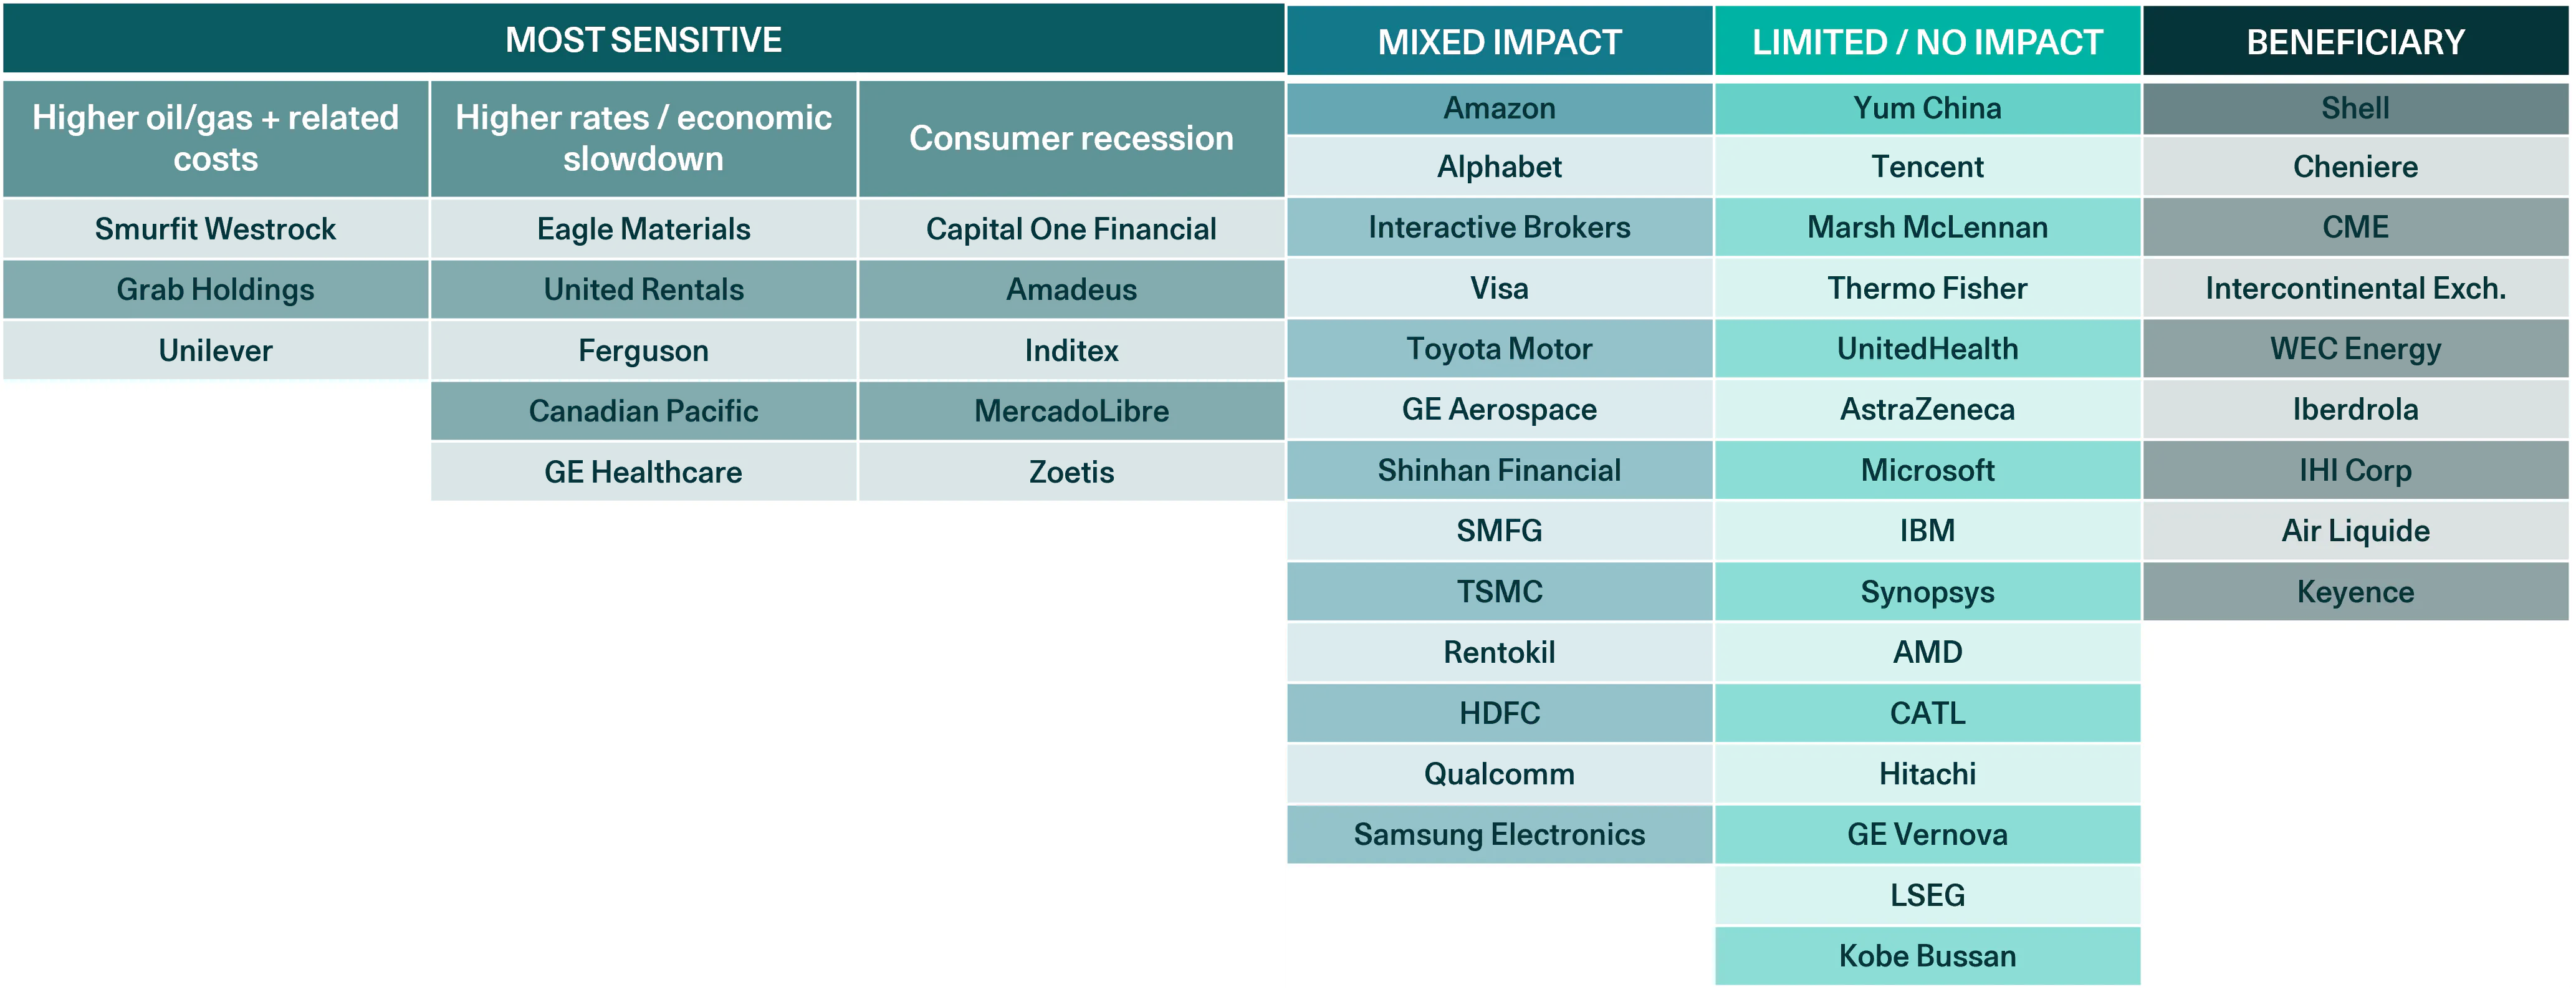
Source: W1M. As at 20.03.26
Risk warning: The information above is for information purposes only and should not be considered a solicitation to buy or an offer to sell a security. It is based on our current view of markets and is subject to change
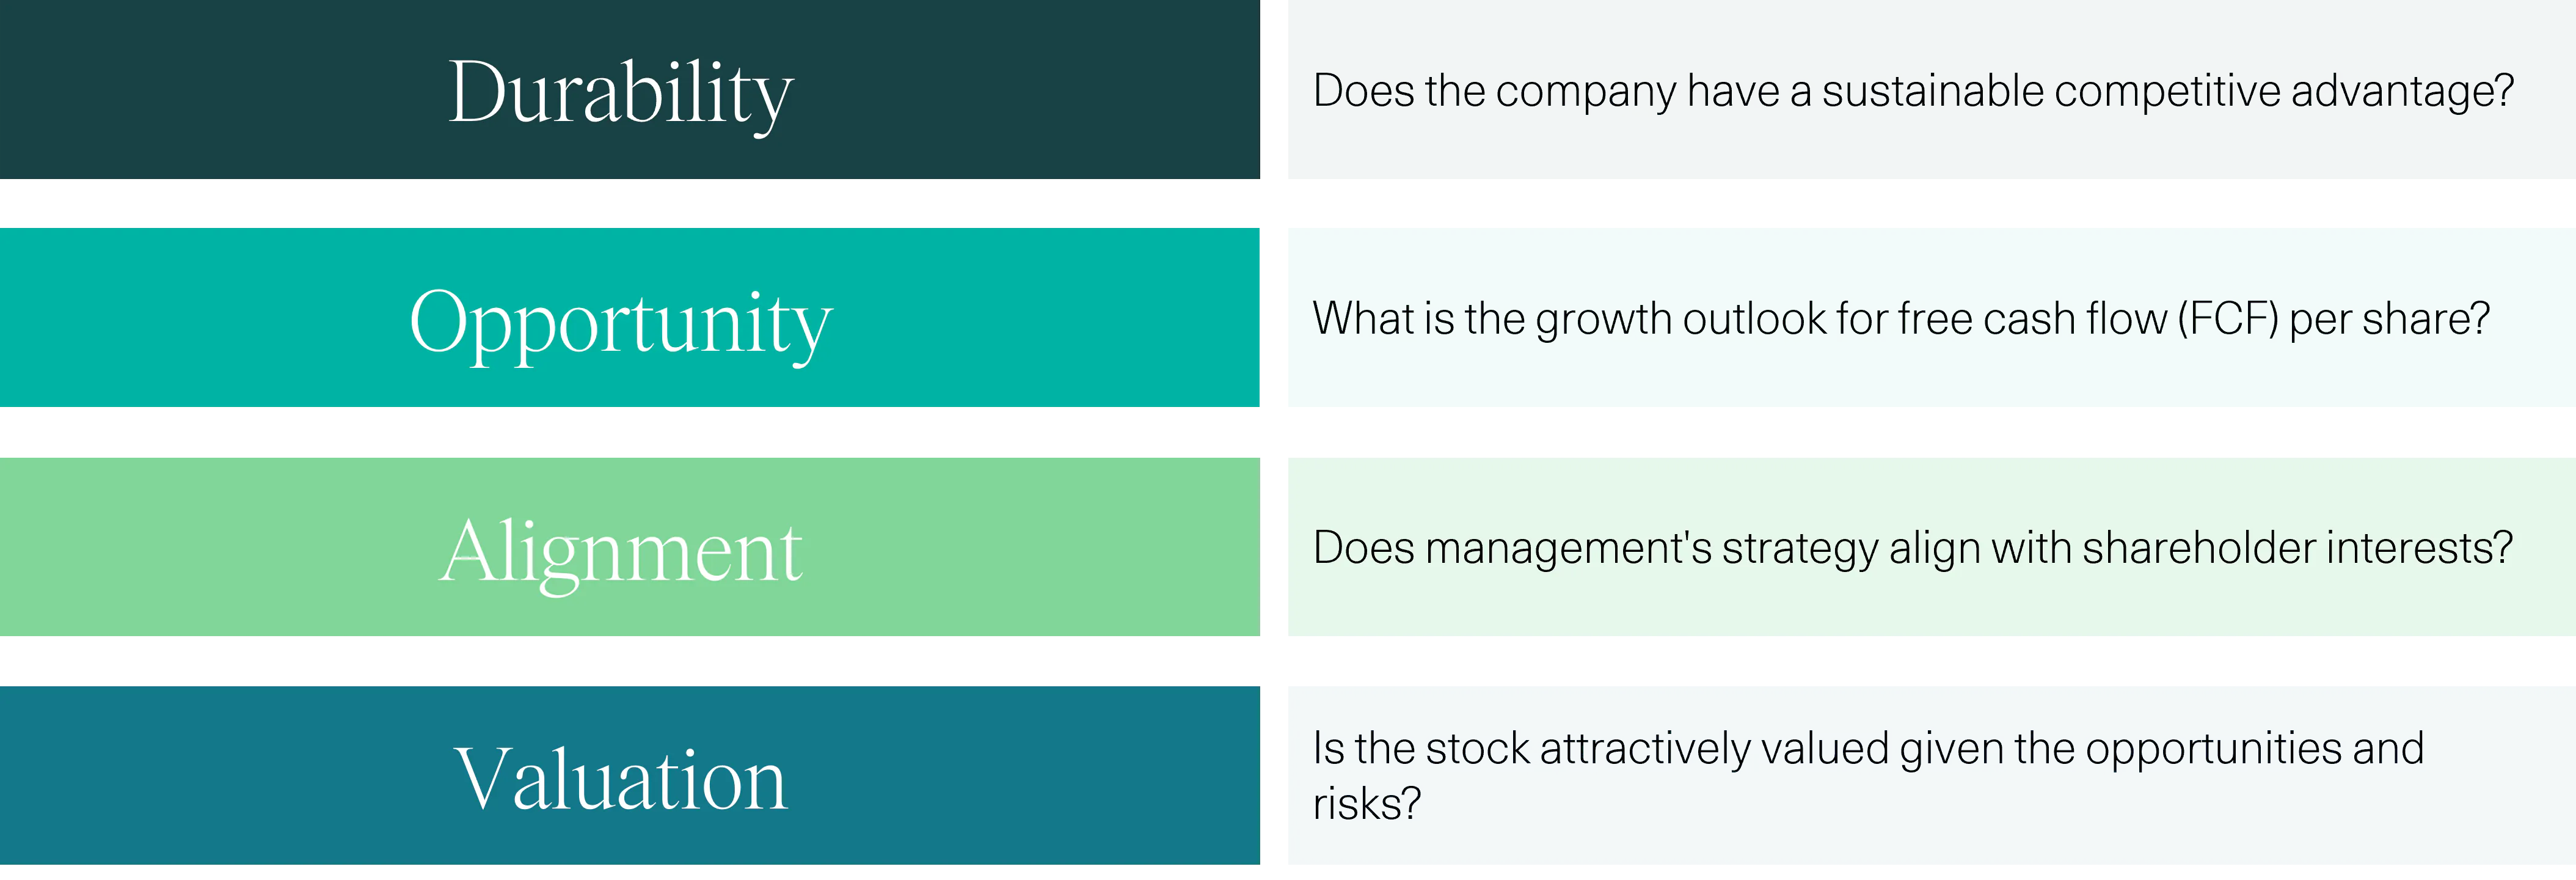
Businesses which have to use a lot of energy or are exposed to rising oil-related input costs (e.g. plastic packaging, fertilizers) are clearly under scrutiny currently. We have positions in companies like Smurfit Westrock (a paper and packaging firm) , Grab Holdings (the Asia-Pacific equivalent of Uber), Unilever (global manufacturer of food and household products), Eagle Materials (US cement related revenues) and Canadian Pacific (North American freight railroad) which, as the table shows, are sensitive to higher energy prices. The key question in assessing them is whether we are seeing a temporary fuel price spike or a longer-term, more damaging step change which could last years. The view that the middle eastern conflict is likely to be shorter rather than longer means that we are not minded to exit positions in companies where we see medium to long-term attractive cases but which face short-term pressures. This can change but having a process which selects stocks based on their “durability, opportunity, alignment and valuation” gives us a portfolio which has been constructed to give it resilience, and exposure to companies we expect to emerge competitively stronger. When it comes to inflation rising, the “durability” of a company, its competitive edge and pricing power, are clearly key.
Equities - selection process
Evaluation of four clearly defined criteria underpins our fundamental analysis
Some companies we hold, like Shell and Intercontinental Exchange, benefit directly from higher oil prices, but battery technology stocks have also benefited in that the need for diversification away from fossil fuels is highlighted when prices spike; CATL, a leading global battery company (used in electric vehicles and energy storage systems) based in China, has seen its shares perform very strongly this year and we have been reducing positions, taking some profits but remaining invested. Asian Equities have provided a number of compelling new ideas for us over the last 18 months, just as global equity performance has become less US-centric (see Benjamin Hall, Manager of the Waverton Asia Pacific Equity Fund discusses investment opportunities in China). Banks are sensitive to interest rates and Japanese names like SMFG have had a strong run which also leads us to trim large positions given a weakening global growth outlook now. Other stocks have lagged in the current environment and that leads us to make sure our 3-5 year thesis for each stock remains intact, with a view to potentially reducing exposures but also selectively to add to names where conviction in our medium to longer-term investment case remains high. A recent addition to portfolios is the Japanese stock IHI which has exposure to aerospace, defence and space equipment; we see its management focussed on improving shareholder returns through a significant corporate simplification programme, and growing demand for its defence related products; market weakness gives us an opportunity to add to our holdings. Japan has been a rich source of ideas for us in the recent past (see Japan’s evolving space industry: opportunities and government support | W1M). Air Liquide, a global leader in industrial gases, is another stock we like in the medium to long-term, with its diversified end markets and long-term contracts (with inbuilt cost escalators), providing greater revenue and earnings visibility in an environment of slowing growth.
Real Assets
Our real assets holdings are much more than just gold or commodity positions but exposures to real estate, power generation, renewables etc. However, gold has been a great contributor to returns over the last year or so. This year, it has surprised some by being weaker. Why has gold fallen? Firstly, recent price weakness must be seen in a 12-24 month window in which there were huge gains; some profit taking is no surprise, especially when liquidity may be more highly prized. Secondly, with inflation and interest rate expectations no longer falling but rising, an asset class with no yield may seem less attractive. Thirdly, we may be seeing a healthy correction with shorter term speculators exiting.
In January, before recent gold price weakness and after a very strong run, we took some profits in gold and steps to mitigate potential downside (see Navigating the recent gold market correction | W1M). We do not see the long term case for gold diminished (it gives protection against fiat currency debasement and long-term inflation resilience) and the chart below shows that it is not necessarily expensive.
Gold - is it "expensive"?
Gold price per troy ounce relative to S&P 500 Index price - 1971 - current monthly
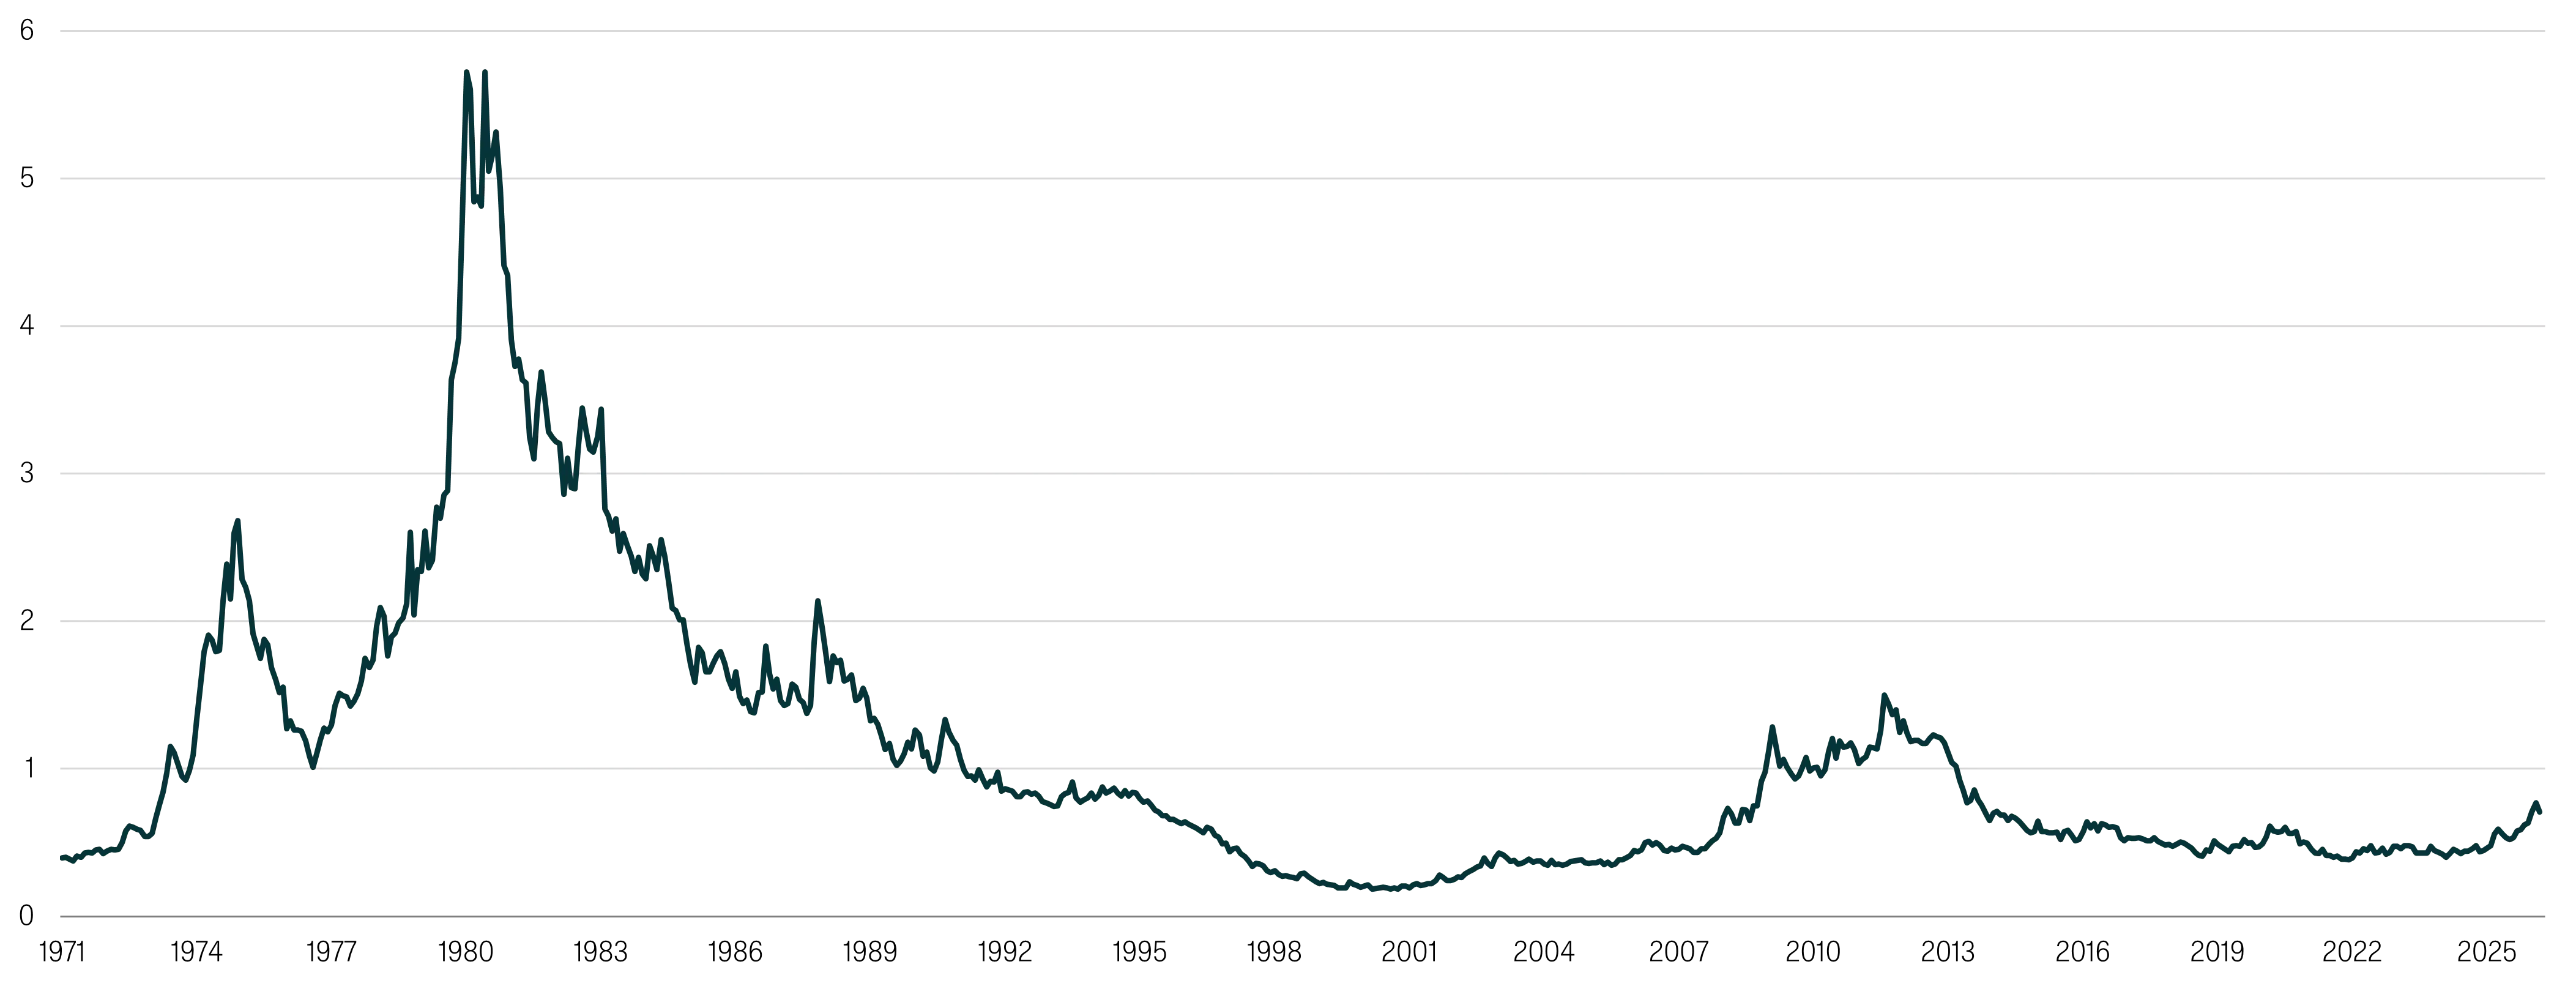
Source: Bloomberg, W1M. As at 27.02.26
Fixed Income
We remain underweight fixed income. Earlier in the year, we reduced duration in portfolios reflecting uncertainty in UK politics impacting gilt markets. Now, with more concern about inflation in fixed income markets, we have added to US exposure, which also increases US dollar holdings, as that is likely to make portfolios more resilient in nervous markets. The UK does not have the energy self-sufficiency of the US and is perceived as more vulnerable to inflation resulting from higher oil prices, making gilts less defensive than treasuries potentially. We continue to find interesting fixed income ideas globally (see Carry & convexity: Opportunities in Emerging Market rates | W1M). The chart below illustrates how W1M is active in fixed income.
Active vs passive: Fixed Income
Portfolio characteristics: delivering superior long-term outcomes with higher yield and lower drawdowns vs the index
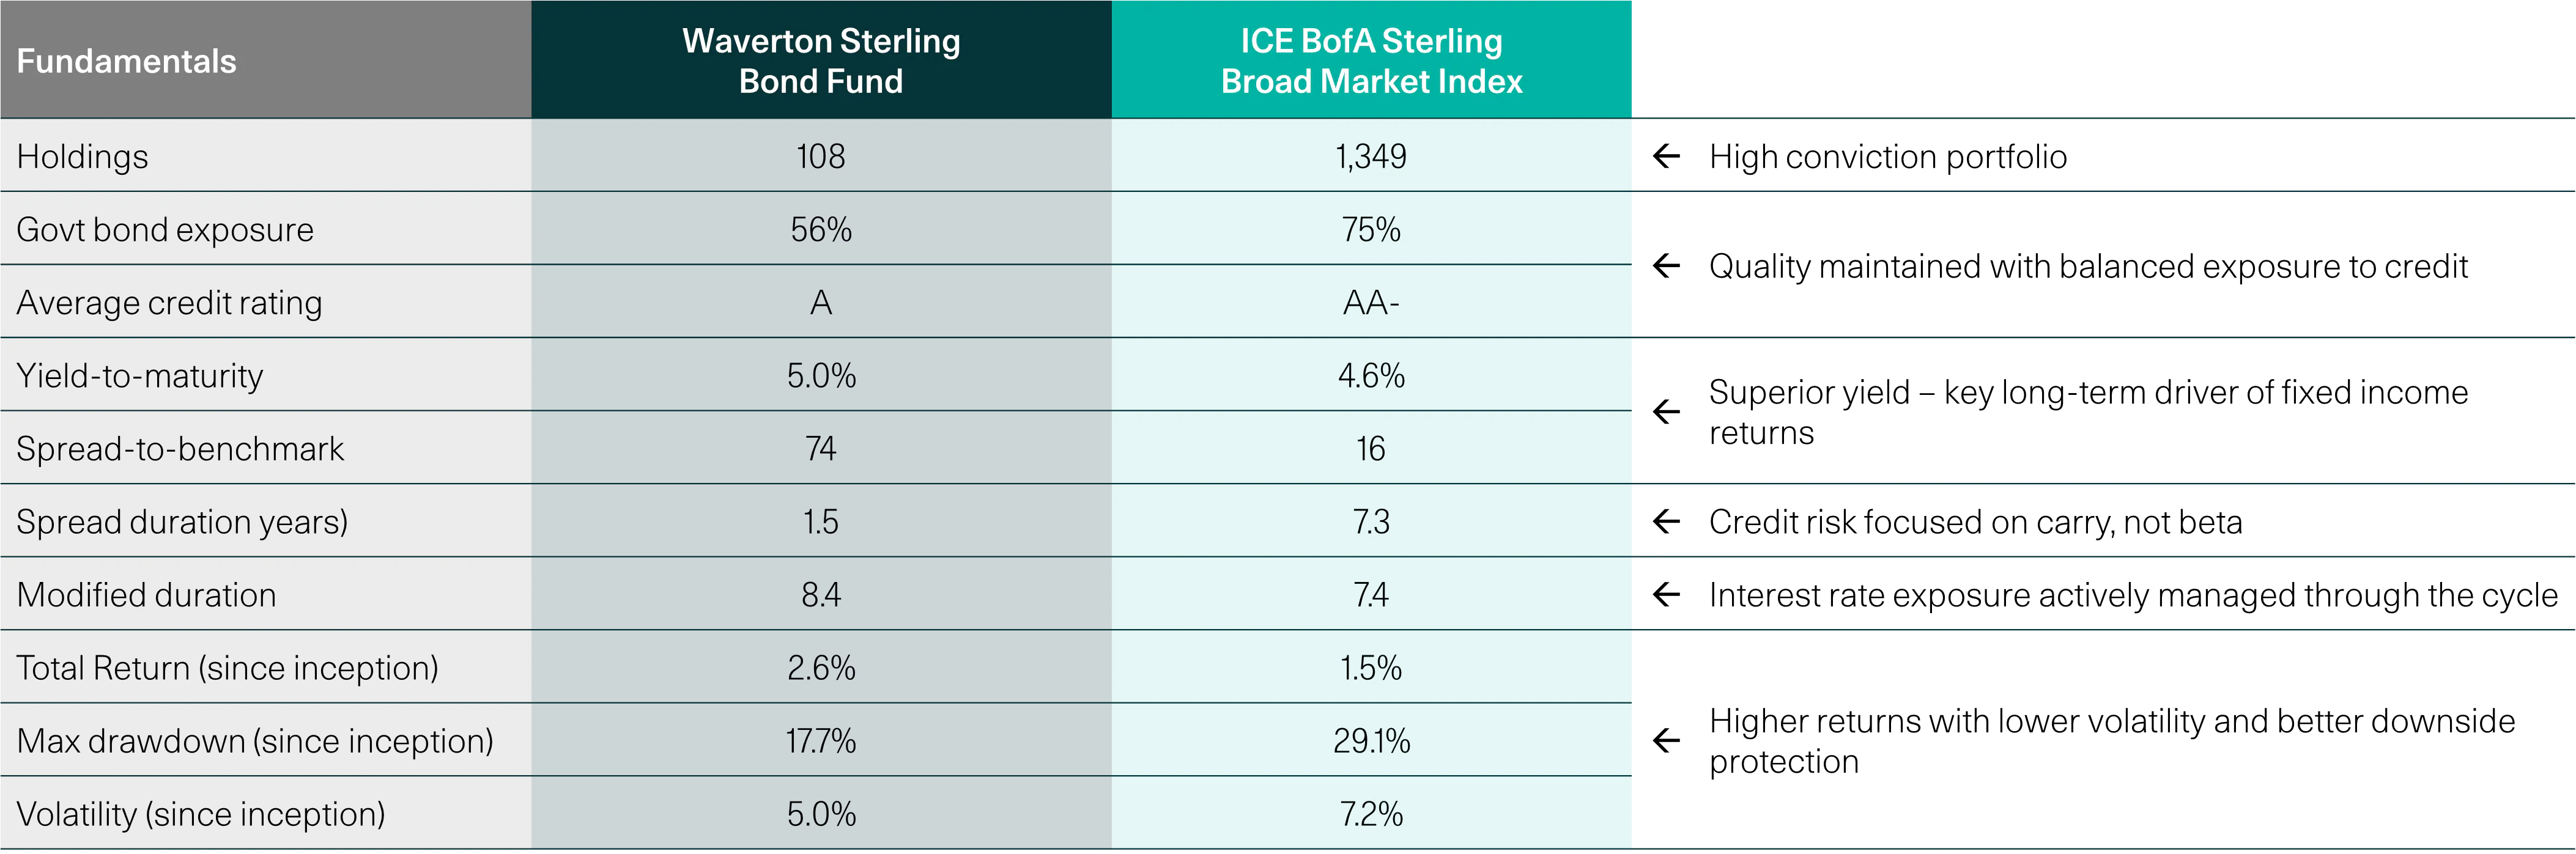
Source: ICE BofA, W1M. As at 31.01.2026
Risk warning: Past performance is no guarantee of future results and the value of such investments and their strategies may fall as well as rise.
An Example of activity in the Multi-Asset Funds:
All W1M multi asset solutions (bespoke and model portfolios as well as funds) are global, direct and active. The way the W1M Multi Asset Income Fund has responded to a changing global macro environment is described here: Portfolio activity amidst Middle East tensions
Past performance is not a reliable indicator of future results. The value of investments and the income derived from them may rise as well as fall, and investors may not get back the amount originally invested. Capital security is not guaranteed.
This material is provided for informational purposes only and does not constitute investment advice or a recommendation. It should not be considered an offer to buy or sell any financial instrument or security. Any investment should be made based on a full understanding of the relevant documentation, including a private placement memorandum or offering documents where applicable. W1M Wealth Management Limited is authorised and regulated by both by the Financial Conduct Authority of 12 Endeavour Square, London E20 1JN, with firm reference number 120776 and the U.S. Securities and Exchange Commission of 100 F Street, NE Washington, DC 20549, with firm reference number 801-63787. Registered in England and Wales, Company Number 02080604.
All rights reserved. No part of this publication may be reproduced, distributed, or transmitted in any form or by any means, including photocopying, recording, or other electronic or mechanical methods, without prior written permission from W1M Wealth Management Limited.
Copyright © 2026 W1M Wealth Management Limited.